Portfolio
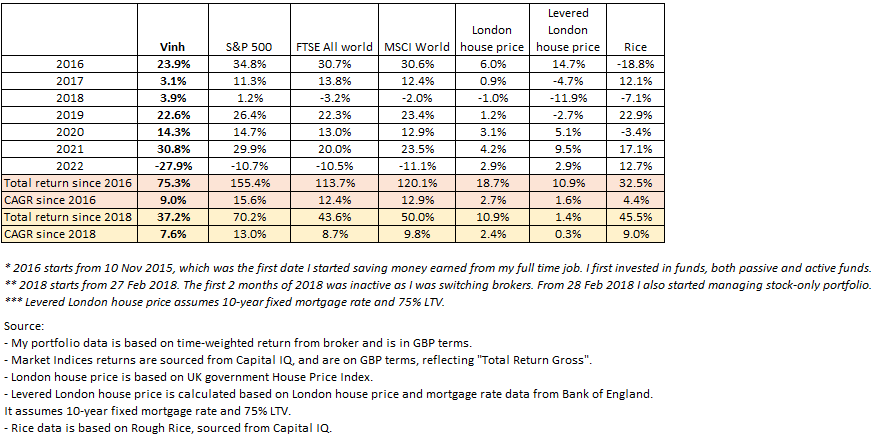
My portfolio went down 28% in the first half of 2022, which is 17% more than the S&P 500 (Total return, GBP index).
The performance on a relative basis looks very poor. A big part of the underperformance came from the 50% decline in Meta Platform (formerly Facebook) share price. Rest of my portfolio went down more than the market.
This inevitably requires me to pause and think whether any major mistake has been made. Lessons can then be learned quickly.
Much of the work last quarter has been about this: to know where a mistake was made and to learn quickly.
Meta Platform (Facebook)
My cost basis on Meta is $250 a share, which implies a 16x 2021 after-tax GAAP earnings, excluding cash. Inversely, this was a healthy 6% starting yield.
The key thesis for Meta is that it is a strong company with network effect amongst the 3bn users and 100 million advertisers, and an intense engineering culture that is designed to churn out good engaging social media features over time.
The other thesis is that the digital advertising market would continue to grow at 10% p.a. and Meta, being above average should grow at a rate higher than this, perhaps around 12-15% p.a., implying market share taking over time.
Fast forward to 2022, half of my thesis now looks at risk. This half is related to the growth rate assumptions, I.e., the 12-15% p.a. growth rate. This starts to look like a mistake of misjudging the potential growth rate of Meta. This mistake stems from my underestimation of:
- The reliance of Meta on Apple digital real estate – iOS. Any change of rule on the estate, most recently the iOS 14 update that limits user tracking, can adversely affect Meta revenue;
- On a related note, any apps making money on the said digital real estate can roll out their product quickly to the billion users using Apple devices. And one that benefited a lot from this is TikTok. TikTok clearly has made a large dent on Meta’s potential revenue growth.
Whilst a part of our thesis is now looking wrong, the initial purchase of 16x earnings ex cash still looks relatively ok even when the growth rate decelerates to 0. (16x is equivalent to 6% yield which is twice the bond yield).
However, Meta stock is now trading at 10x 2021 earnings, excluding cash, which implies 2021 earnings were already peak earnings for Meta. This is where I think the market is wrong and hence at 10x earning, the stock looks very attractive.
As future savings come in, I will be likely to purchase more Meta.
Opportunities
Looking at the portfolio, I note:
- Google is trading at ~16x ex-cash 2022 after-tax Google-services earnings, assuming no value to Google Cloud Platform.
- Amazon is trading at $1.1 trillion valuation which assumes no value to the $700bn-GMV ecommerce business.
- NYT is trading at 17x ex-cash 2022 net earnings
- Blackstone and BAM are trading at around 15x-18x LTM net earnings (including performance income)
All of them look attractive.
Though one stood out…
Amazon
Amongst the opportunities above, together with opportunities in the market, I made the decision to buy more of the most attractive idea, which is Amazon. Given the portfolio was low on cash during the first half of 2022, some selling of other positions were required to raise the funds to purchase Amazon.
In simple terms, Amazon AWS and advertising business are big and quite profitable. AWS did $18bn reported EBIT in 2021, and Amazon advertising business should command +45% profit margin, in line with Google and Facebook, which would equate to $12-16bn in EBIT.
Taking AWS and Advertising together and considering the reported EBIT of the entire Amazon business of $25bn in 2021, this implies the Amazon retail business and Prime made a loss of $9bn in 2021.
Amazon retail did a GMV of $620bn in 2021, and Prime made $30bn in revenue, this implied that this business of Amazon, with revenue of $650bn is having a loss margin of 1.4% ($9bn losses divided by $650bn revenue).
This loss margin stems from a few growth initiatives inside Amazon retail and prime, notably:
- Passing on Amazon 1P gross margin to customers: Amazon 1P gross margin post merchandise costs but before shipping cost is around 25%, compared to Walmart gross margin post merchandise costs and after shipping costs of 25% (meaning mark up on merchandise at Walmart is higher than Amazon, I.e. less savings passed on to customers).
- Shipping offers: Amazon simply shipped significantly more two-day, one-day, same-day items than any other online and online/offline retailers in the markets it operates in. As a result, shipping, and fulfilment costs as % of GMV have risen from 12% in 2010 to 24% in 2021.
These initiatives have helped Amazon GMV increase 13x over the last 10 years and continue to remain the key engine of growth in the years to come.
That said, a short-term effect of these growth initiatives is that it hides the profitability of Amazon retail and Prime business. This is because the costs associated with these initiatives are recognized not only in the cashflow statement (I.e. investments made on fulfilment warehouses) but also in the profit and loss account (I.e. low merchandise mark up is reflected in the cost of sales and costs related to shipping and fulfilment are reflected in operating expense)…
…hence the $9bn loss noted above for Amazon retail and Prime.
So in theory, when Amazon approaches a steady state where it no longer makes sense to grow (e.g. ecommerce can no longer take share from offline retail), then Amazon can dial back these growth spending and start accumulating profits.
Considering the 2 initiatives above, in steady state, if Amazon 1P can mark up its merchandise by another 5%, and work to reduce shipping and fulfilment cost as a % of GMV by 6%, the Amazon retail and Prime business will be able to achieve an operating income margin of ~6% (~6% = 5% 1P mark-up x 1P GMV share of 35% + 6% savings on shipping and fulfilment – 1.4% current loss margin).
Assuming a 16x EBIT multiple would translate into a 1x GMV valuation for the Amazon retail + Prime business.
I expect 2022 GMV is $700bn, so Amazon retail is worth $700bn
AWS is on track for a $80bn+ revenue in 2022, and an operating income of $32bn. Assuming a 20x EBIT multiple yields a AWS value of $640bn.
Advertising is on track for a $40bn revenue in 2022, and an operating income of $20bn. Assuming a 20x EBIT multiple yields a Advertising value of $400bn.
Cash of $50bn
Adding these up yields a value of Amazon end of 2022 of $1.8 trillion or a per share value of $180/share of value in 2022, or a 60%+ upside from here.
