Performance
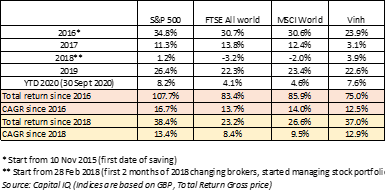
Since the depth of the Covid-19 induced crisis, the market has increased by 50%. The bullish market was driven by both fiscal and monetary stimulus from the US government and US central bank. What we learned from observing the period is that most of the bullishness might have been more driven by the fiscal side. As Chair Powell taught us:
“These [Federal Reserve’s monetary support] are lending powers, not spending powers. The Fed cannot grant money to particular beneficiaries. We can only create programs or facilities with broad-based eligibility to make loans to solvent entities with the expectation that the loans will be repaid. Many borrowers will benefit from these programs, as will the overall economy. But for many others, getting a loan that may be difficult to repay may not be the answer. In these cases, direct fiscal support may be needed. Elected officials have the power to tax and spend and to make decisions about where we, as a society, should direct our collective resources. The fiscal policy actions that have been taken thus far have made a critical difference to families, businesses, and communities across the country.” – Press Conference – 29 July 2020.
The bullishness of Q2 and Q3 2020 led many to conclude that the S&P 500 is expensive. At the moment, from what we can see, the market is willing to pay around 22x next year earnings (i.e. 4.4% next year earnings yield) to own 500 American listed companies.
What does this valuation multiple actually mean?
“Revert, revert, always revert” We note that with a normalised discount rate of 6.0% – a rate we apply to all productive assets, the implied steady state growth rate of the index is effectively 1.6% (6.0% minus 1.6% gets you 4.4%). 1.6%, coincidentally is what the Congressional Budget Office predicts US GDP growth rate to be for the next 30 year.
22x next year earnings multiple for S&P 500 is no doubt high relative to its history (average S&P 500 multiple is around 16x), but as mathematics lay it bare, it’s actually not that high when one considers:
1/ the conservatism of the discount rate: the normalised 6% discount rate is quite conservative as compared to the 0% rate on government bonds and
2/ the conservatism of the long-term growth rate of 1.6%: would the best corporations of the world only grow their earnings by a meagre 1.6% for the next 30 years?!
High but not that high…our rather confusing line of thoughts is summarised succinctly as follow:
“The market looks high, and it is high; but it’s not as high as it looks” – Benjamin Graham
Wells Fargo mistake
Year to date, the costliest commission mistake for us was to own Wells Fargo.
Our original thesis in buying Wells Fargo back in 2016/17 was:
- 15%+ or so from share buyback and dividend as the company paid out all of its earnings to shareholders
- 1% per annum organic growth, from deposit and loan growth
- Some catch-up organic growth as and when the new CEO of Wells Fargo moved swiftly to fix the company’s reputation and structure following the cross-selling scandal (i.e. lift the asset cap, and realise cost savings)
The first point was completely wrecked by the pandemic as interest rate went down to 0 and soon enough the bank suspended its share buy back program. Our mistake, amidst a small one, was our underestimation of the central bank and US government’s attitude to do whatever it takes to help the financial market in face with a panic.
The second goal was actually achieved, as deposit/loans and just generally total assets grew by roughly 1-2% since 2015, and they actually also grew during the pandemic thanks to the fiscal program of the US government.
However, the third point of our thesis was our most serious mistake. We had little experience buying into a turn-around situation, which is what Wells Fargo has been over the last 4 years, and hence underestimated the gigantic effort that the new management team needed to pull off:
- 4 year since, the only thing that Wells Fargo achieved was to finally have a committed new CEO – Mr Charlie Scharf
- The asset cap was not lifted
- The efficiency ratio (the lower the better) increased from 57% in 2015 to 82% by Q2 2020!!! Adding some $10bn of unnecessary costs for the company
Lesson learned: Once a bank seriously damages its reputation, be very wary. Banking lives on trust, not least because their business model is based on trust (e.g. we trust Wells Fargo so much we deposit nearly $2 trillion worth of deposits with the bank), so once the trust is shaken, just be very wary.
All in all, not only did the mistake cost our portfolio 2%, but more if we counted the opportunity costs had we used the money to say, buy more Facebook.
We feel better about our mistake whenever Facebook stock goes down!
A corner of the market
Before going into the company updates, I’d like to talk about a particular corner of the market where the cloud/software companies reside.
These companies occupy a dynamic corner of the market, with extraordinary growth rates over their relatively short history, and you guess it, they sport extraordinary multiples too.
To illustrate the said characteristics, we have shown below the “The BVP Nasdaq Emerging Cloud Index” which is an index that tracks emerging public companies that provide cloud software to their customers. The index was constructed by Bessemer Venture Partners:
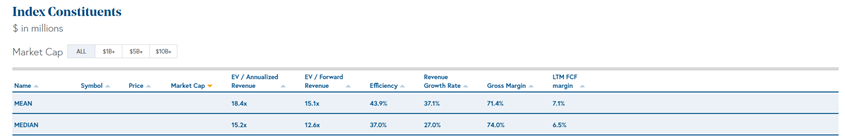
Source: BVP website
These are quite extraordinary valuation multiples.
One could argue that 10-20x next year revenue valuation can be easily justified if:
1/ the revenue keeps growing 20-30% year on year for an extended period of time, say 5 years, and
2/ when winner-takes-all position has been formed, all P&L investments (e.g. marketing costs) can reduce significantly or even removed in its entirety.
Regarding point number 2, the marketing costs in the digital economy are argued by the cloud investors to be the equivalence of “capex” for a normal company. Though for a typical company the capex is normally spent via the balance sheet/cashflow, the marketing costs are recognised directly in the P&L. Hence, earnings are artificially depressed, and so any earning-based multiples would yield ridiculous triple-digit figures.
But one thing we note is that for the cloud software companies to attain the winner-take-all position as mentioned in point number 2 the marketing costs have to be spent wisely. That means the value of the new customers that they acquire via marketing spending should be worth multiples of the marketing costs laid out upfront.
Whilst there are many examples of wise marketing spending and that the line of logic of value investors in the cloud space: “if marketing costs are removed once enough customers are acquired, the company is not that highly priced at the current multiple” makes good sense to me, there are still a couple of known unknowns (knowable stuff that I’m yet figuring out) remain:
a. What are the key factors determining a successful marketing campaign? Would it be all about your proficiency in performance-based marketing or would it be all about the quality of the product?
b. If it’s a mixture of the above, how can I build conviction? Maybe use the product, talk to the person who work on the marketing campaign?
c. If everything is just about marketing spending, why don’t the big guys throw a ton of money in it and kill off any emerging threat?
d. Would investing in a relatively young fast-growing digital-based company mean a sacrifice of moat to get growth? How comfortable am I in doing that? Wouldn’t buying a solid moaty company at 20x pre-tax earnings multiple growing 10-15% a year a much safer (and sometimes more economically too) choice than buying a no-moat company at 20x revenue multiple with a historical growth rate of 30% a year?
e. Even when conviction is built what would be an appropriate position size? Putting an eye-dropping amount hoping for a double isn’t worth the trouble when one can put 20% in a company that grows nicely 10-15% a year.
One thing for sure, the lower the valuation multiples the more margin of error one would have and hence the less accurate the answers to these questions need to be.
We remain a keen observer of this corner of the market as they serve a very important function in our society: delivering great services via the cloud to consumers and businesses, at little to no costs.
Company updates
In the previous quarter, we covered the operational updates on our larger positions. For this quarter we will aim to cover a few of the medium to smaller positions in the portfolio:
Apple
Our original thesis of buying Apple in late 2018 was simple:
• it was a 10x pre-tax earnings purchase
• organically it could grow mid-single digit thanks to half of its product portfolio (e.g. iPad, wearables and services) growing at double digit offsetting the single digit decline in iPhone, and
• it could spend more than it earned in a year on share buyback and dividend
Overall, 10%+ from share purchase and dividend + mid-single digit organic growth (note: Apple requires almost no capital to grow) gave investors an attractive total return of 15%+.
The opportunity arose then because the market was over concerned about half of Apple product portfolio was in decline (i.e. the iPhone franchise) and forgot that Apple was more than just an iPhone company.
Having said that, over the last 6 months, the iPhone franchise has finally recovered, growing at a modest 2.0% year on year versus a single digit decline in prior year. This contributes to the ever-growing installed base of Apple-designed products. The install base is what makes me even more excited about owning Apple. It gives Apple the best of both worlds:
1/ pricing power of a great luxury-affordable consumer product and
2/ switching cost of a software company.
“If you look at iPhone in totality the things that get me very optimistic is the size of the active installed base” – Tim Cook – Q3 2020 conference call
Amazon
We enjoyed reading the latest book on Amazon during the quarter. The title of the book is “Bezonomics” by Brian Dumaine.
One point that really jumped out from the book is with regards to the value creation flywheel of Amazon, especially Prime memberships. It is summarised in the passage below:
“Amazon believes that Prime Video is a formidable and profitable way to attract new Prime members. Here’s how it works. The company assumes that if the first thing a Prime member does after signing up is watch a movie or TV show, then Prime Video was the reason the person joined Prime. The example in the documents that best illustrates this point is The Man in the High Castle, a fantasy drama set in a universe in which Nazi Germany and Imperial Japan have won World War II and split America into two competing and hostile colonies. The show attracted 8 million U.S. viewers as of early 2017. The crucial metric, however, was that the show worldwide attracted 1.15 million new Prime subscribers whose first interaction with the membership program was to watch The Man in the High Castle. Amazon spent $ 72 million to produce and market the series, which works out to a recruitment cost of $ 63 per subscriber. At the time, Prime subscribers were paying $ 99 a year for a Prime membership, which more than covered that cost. Perhaps most important, Prime members spend on average $ 1,300 a year at Amazon—almost twice as much a year as nonmembers. When viewed from that perspective, investing in The Man in the High Castle became a no-brainer.”
Mr Brian Dumaine, no-brainer it is indeed!
Visa
Visa makes money by taking a cut on all payments that flow through its network. And its network is huge: roughly $8 trillion of payments runs on Visa “rail”.
A few things jumped out during the quarter:
Contactless
“In the United States, we added more than 80 million contactless cards in the first six months of calendar year 2020” – Al Kelly – CEO of Visa – Q3 20 call
And the goal for FY20 is:
“where we are in the US, we have issued over 200 million cards out there now and we expect to have 300 million contactless cards by the end of the calendar year.” Mike Milotich- Managing Director, Visa – Key Banc Capital Markets – 9 Sept 20
Now that was just the US:
“outside the US two-thirds of all of our face to face transactions is now – are now contactless that we process.”
Ok that’s all nice and good. But why is contactless important?
“So, as contactless payments become ubiquitous, consumers really love it. I use this quote all the time, but once the market has gone contactless and when we actually talked to consumers, it’s not like they say, well, I like this contactless payments thing, 17.3% better than the old model. They always say, what the heck were we doing before and why haven’t we always paid this way.” – Oliver Jenkyn – Regional President, North America, Visa – Deustche bank 2020 Virtual Technology conference – 15 Sept 2020
Contactless is the way to go. Especially when it comes to cash transaction displacement at the micro level. You can just tap and pay for that Pumpkin spice latte at Starbucks in under 2 seconds. Convenience is the name of the game here!
B2B
Moving forwards, outside of contactless and the continued displacement of consumer-expenditure cash, we will focus on monitoring the cash displacement at the business to business level (“B2B”). At the moment, B2B transactions account for roughly 12% of total transactions at both Visa and Mastercard, with Visa at slightly higher total volume. Visa pursued this space with “Visa B2B connect” whilst Mastercard pursued this space with “Mastercard Track Program” and both aim to crack the code in cross-border B2B transaction first.
Valuation
Lastly, on valuation, no doubt the two payment companies are highly priced. We won’t add to our position. However, we must caveat by saying that at 30-40x LTM multiple, the market still gets most of the future growth in B2B for free. Why? Because from a private investor perspective who say, use a discount rate of 5-6%, if consumer expenditure grows on its own at 2-3% then consumer payments alone explain a significant chunk of the market cap of Visa and Mastercard, ignoring B2B. So our action is to continue hold Visa and not to add to it. In summary we think Visa and Mastercard are both priced appropriately at the private-transaction level.
Inditex
First we find it very comforting that organic sales have now closely come back to pre-pandemic level:
Monthly sales performance in 2020 vs 2019
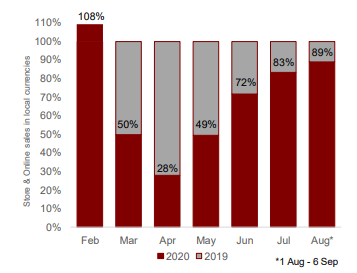
Second, the company still maintains a great liquidity position, with EUR6 billion of cash on balance sheet, untouched throughout the pandemic. Couple more quarters with steady recovery would mean this EUR6 billion of cash go from “required” to “excess”.
Third, online sales for the first half grew 74%, from a very significant base of roughly EUR 3billion online sales last year. Inditex pursues an online strategy where it blends physical and online stores together (think pick up in store). Moving forward Chairman Pablo Isla continued to decidedly pursue store optimisation, i.e. closure of 1000 to 1200 (mainly smaller) stores, increase space per store and roll out online sales globally.
Book recommendation
Bezonomics – Brian Dumaine
Mr Brian Dumaine did a great job summarising and explaining why Amazon does what it does. From expanding its selection beyond book, to allow third party sellers to sell on its platform, to low cost shipping, invest in award-winning movies all wrapped up in Costco-inspired membership – Prime, to invest in things that consumers don’t even know they need it at first – Echo.
“a miracle worker” to quote Mr Charlie Munger when someone asked him about Mr Jeff Bezos.
We have summarised our learnings in the PDF which you can access here.
